Dashboards, but Simpler (and Still Powerful)
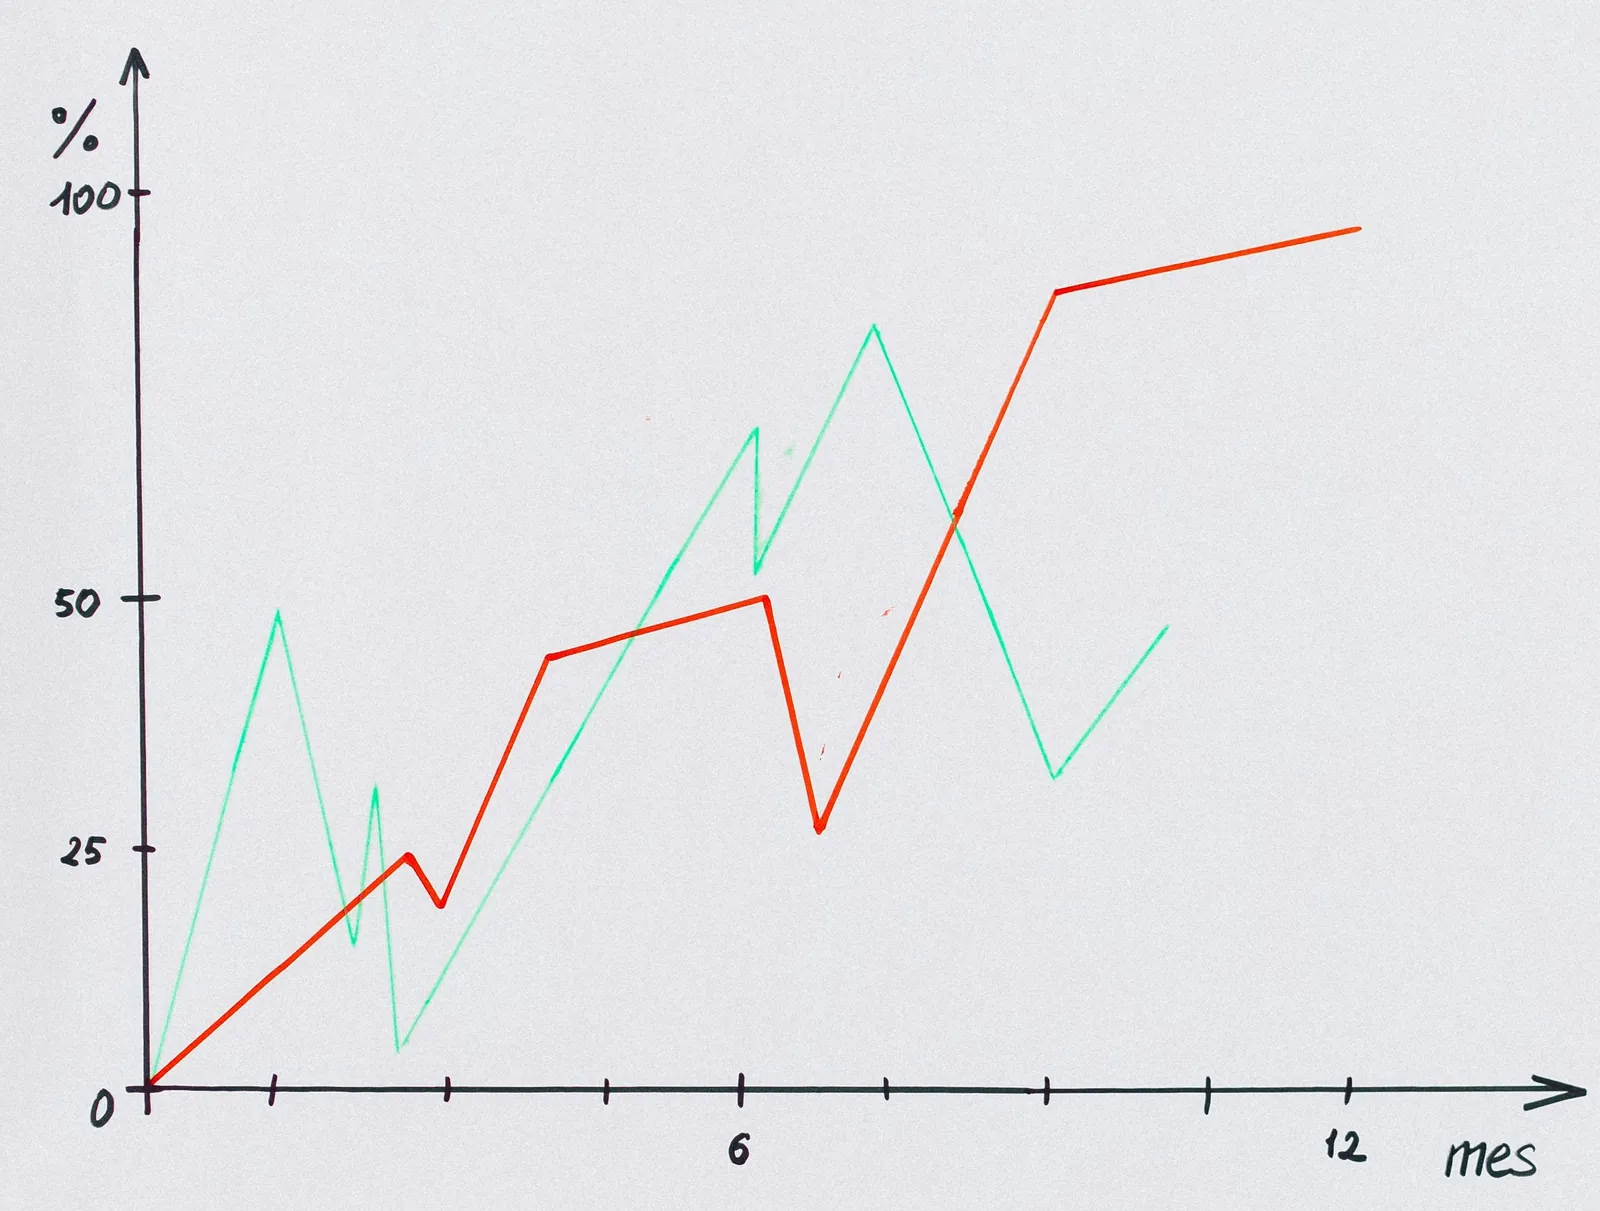
Most dashboard tools assume you have unlimited time, unlimited patience, and possibly a degree in computer science. They demand you connect a data source, configure security settings, transfer your data to their cloud, and then, after several hours (or days) of tinkering, you finally get… a bar chart.
We think that’s a bit much.
At Output Charts, we believe that making dashboards should be as simple as possible, without sacrificing clarity or impact. Our mission is to help you create powerful visuals and tell your data’s story without the hassle. You bring the insights; we make sure they look great.
Your Data Stays Yours—We Don’t Need It
Many analytics tools want to access all of your data. They insist on reading it into memory, transferring it to their cloud storage, or plugging it into their database to extract every metric.
That’s great if you’re running an advanced data science operation or trying to predict the stock market. But if all you need is a clean, professional way to show your boss last quarter’s sales numbers, do you need to move heaven and earth to get a pie chart?
With Output Charts, you don’t have to link a database, import data into a proprietary system, or worry about anyone else poking around your sensitive information. We need the results—the numbers you want to share.
The Right Balance: Simplicity Meets Power
We’re not trying to compete with high-end business intelligence platforms that require dedicated teams, nor are we trying to be a boutique design firm that crafts one-of-a-kind interactive masterpieces. There’s a place for those, and if that’s what you need, fantastic.
But for the rest of us? Sometimes, simple is better.
Our chart types are straightforward but effective—bar charts, pie charts, line graphs, tables, maps, and more. We focus on giving you the essential tools without making you spend a fortune on cloud computing or custom development to display the same data in a slightly fancier way.
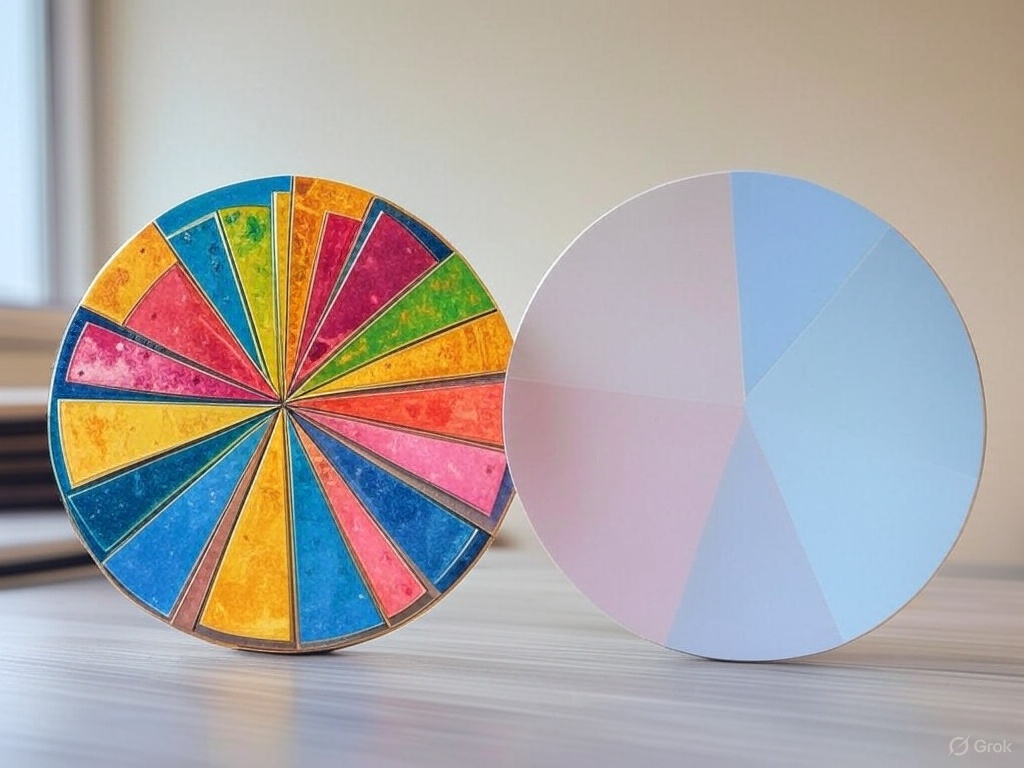
Because let’s face it—a pie chart is a pie chart. If it tells your story, does it need to glow, spin, or animate into the shape of a unicorn?
We’re the Rolex to Your Timex of Dashboards
Some dashboards are like Rolex—hand-crafted, meticulously detailed, and built to impress from every angle. Others are like Timex—functional, reliable, and straightforward.
We consider ourselves the perfect blend of both—we give you sleek, easy-to-use dashboards without unnecessary complications or eye-watering price tags.
- Do you need a simple, straightforward, and shareable way to present data? We’ve got you covered.
- Don’t want to spend hours configuring an integration? No problem.
- Want AI-powered formatting to turn messy data into structured charts? Done.
Output Charts exist to make your life easier. Create your dashboard, drop in your data, and share it with your team—no stress, no unnecessary steps, just insights that look great and tell your story.
So, if you’ve ever felt like making a dashboard should be easier… we agree.
Try Output Charts and get back to what matters—your data, story, and insights.