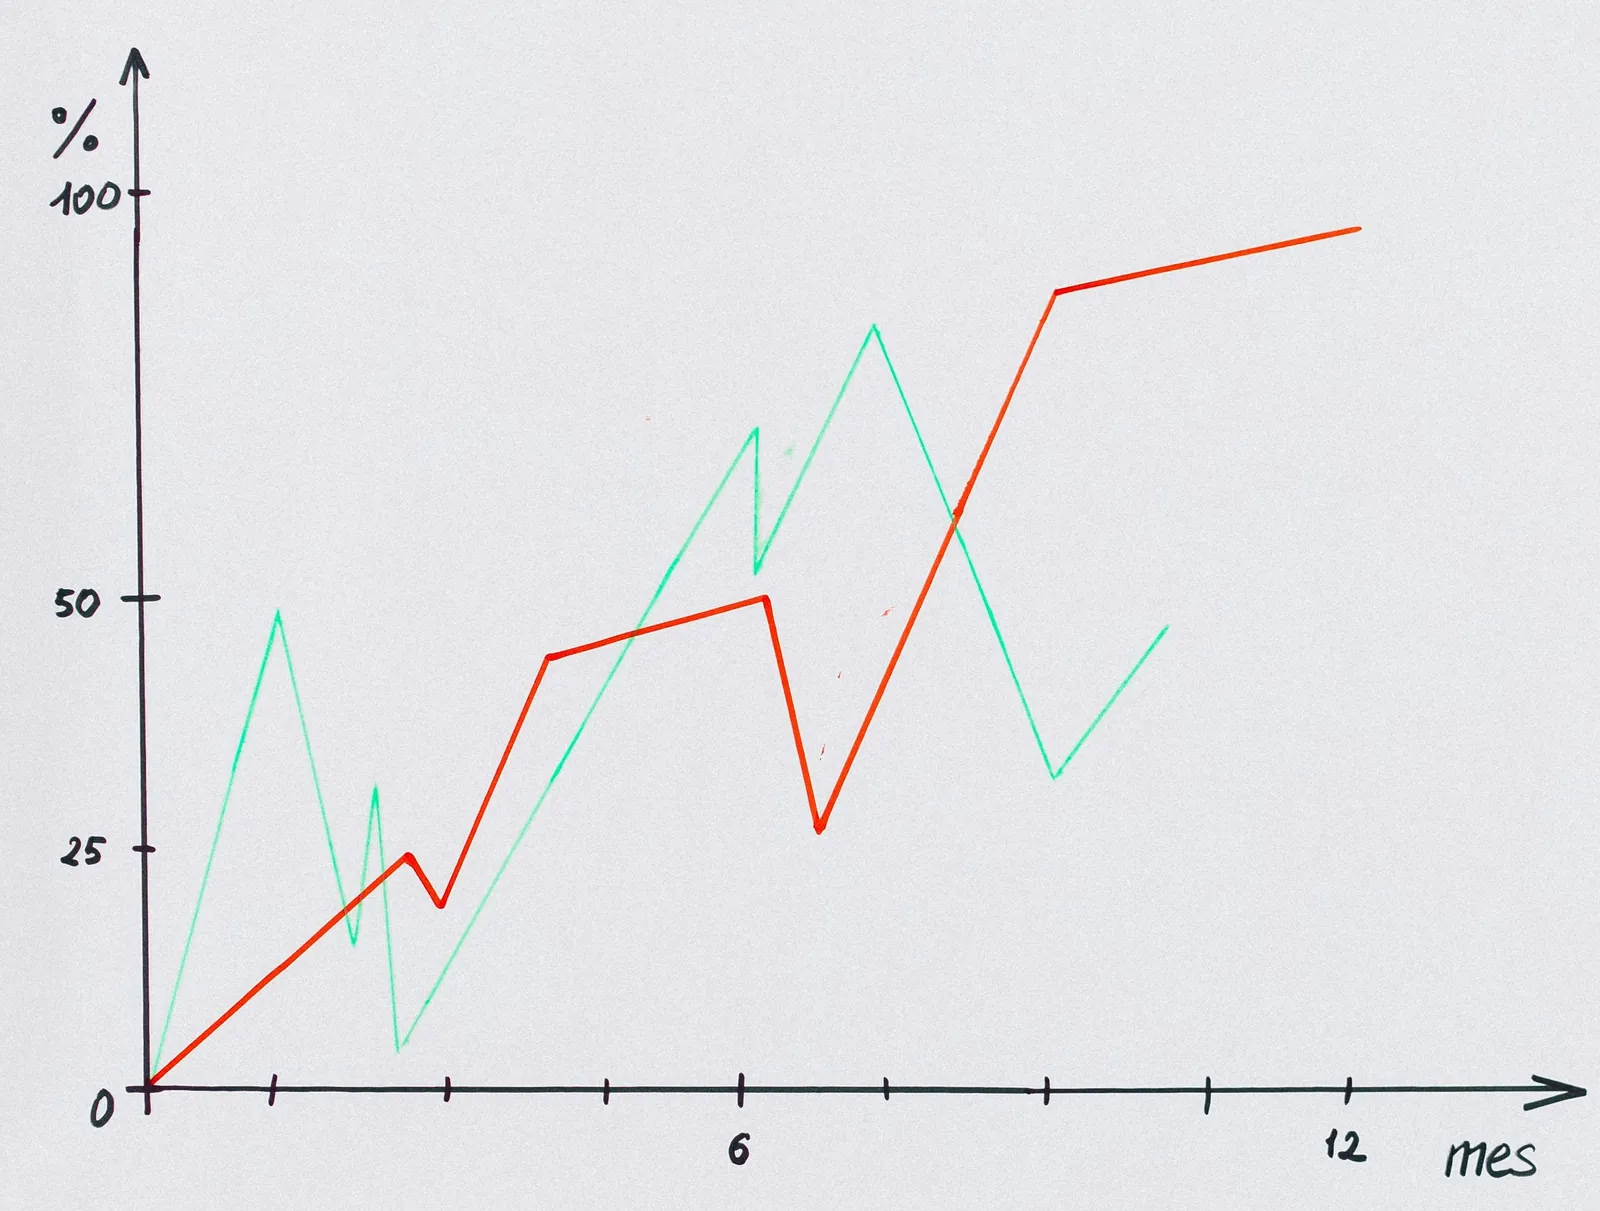
You're not alone if you're tired of overcomplicating your reporting setup.
Many teams rely on bulky software, dedicated servers, connectors, and pipelines to turn a few numbers into a chart.
But what if you could skip all that?
With Output Charts, you can.
Shorten Your Reporting Data Pipelines
Instead of sending raw data through a long series of tools and services, pre-aggregate what you need and send the result directly to a chart. That’s it.
You choose the data, select the chart, and control how and when it updates.
You can:
- Update charts manually in the dashboard editor
- Automate updates with a script or function
A simple Lambda function can run your query daily and send the results to the Output Charts API.
Each chart on your dashboard has a unique ID, and only you can update it using the API key tied to your account.
Strip It Down to What Matters
Here’s the idea: remove the layers between your data and your visuals.
Stop paying for infrastructure you don’t need.
Keep the part that matters—the result—and skip the rest.
One short API call.
One updated chart.
No drama.